This is the first on a series of posts on Windows kernel debugging and exploitation.
In this part, we’ll cover in details how to get everything setup using Linux as host, VirtualBox as hypervisor and Windows virtual images from Modern.IE.
Note: there is nothing ground-breaking here, those posts are mostly notes and reminders for the future. Other people did a fantastic job covering the same topic, so you might probably be more interested into reading those 😁
I like working on a Linux host, so using VirtualKD isn’t an option. So my setup is:
- Debian testing x64 as host
- VirtualBox as hypervisor
- A Windows 7 x64 VM acting as debugger.
- And 2 debuggees:
- Windows 7 x86 VM (using UART as debugging medium)
- Windows 8.1 x64 VM (using Network as debugging medium)
As a commodity, I’ve created a Vagrantfile to simplify the VM creation process using Vagrant. You can create a new Windows VM like this
$ git clone https://github.com/hugsy/modern.ie-vagrant Windows7
$ cd Windows7
$ FIRSTBOOT=1 vagrant up --provision
and go grab a coffee ☕
Preparing the Debugger VM
Once the VM is created and Windows properly installed, edit the VM settings in VirtualBox to do the following:
- In the “Serial Ports” tab, enable one port. You can use any “Port Number” you want, just remember it, as you’ll need to specify it to WinDBG the Win7 debuggee is ready. Select
Host Pipeas “Port Mode” and enter a local path in the “Path/Address” field (for example/tmp/win7-kd-pipe). This pipe will be the relay VirtualBox will use to communicate between the debugger and debuggee through UART. Last, make sure the “Connect to existing pipe/socket” is unchecked.

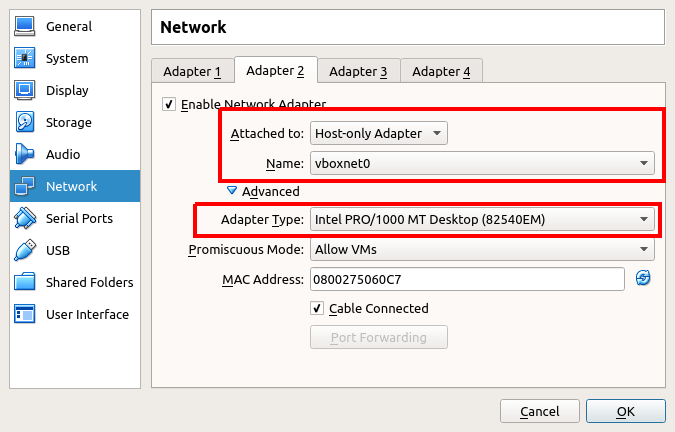
- in the “Network” tab, on top of the the default NAT-ed network created by VirtualBox, add and enable another adapter as Host-Only. Then link it to an existing interface on the host (for example
vboxnet0).
Now the debugger is ready, you need to install WinDBG as the kernel debugger. A quick way, is to use Chocolatey in an administrator prompt to install it as such:
C:\> @"%SystemRoot%\System32\WindowsPowerShell\v1.0\powershell.exe" -NoProfile -InputFormat None -ExecutionPolicy Bypass -Command "iex ((New-Object System.Net.WebClient).DownloadString('https://chocolatey.org/install.ps1'))" && SET "PATH=%PATH%;%ALLUSERSPROFILE%\chocolatey\bin"
<chocolatey is being installed...>
C:\> choco install -y --force windbg
Although this won’t install the very latest WinDBG, this approach is convenient to going through downloading and installing the SDK from MS website. Additionally, you can script it to install more tools useful for later (python, ConEmu, HxD etc.)
Setup UART debugging on the Windows 7 target
Note: All is described here.
All OS can be kernel-debugged via Serial Port (or UART). Although this method is universal, it is also the slowest.
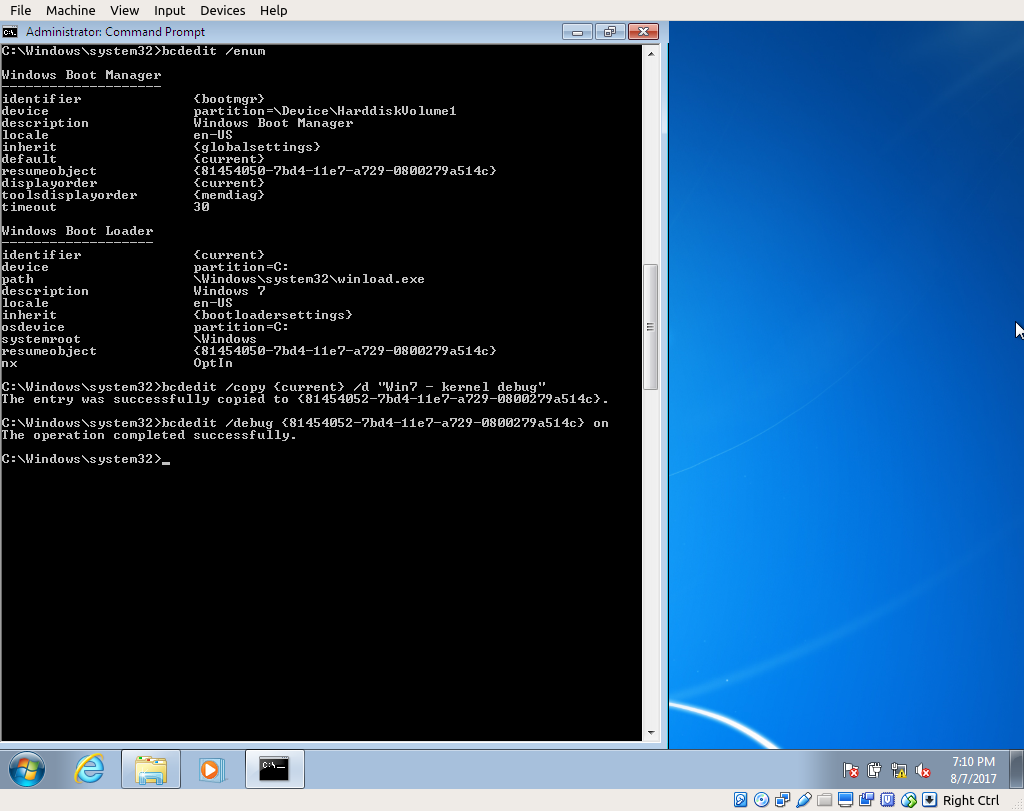
To enable it, start the Windows 7 debuggee VM, open a cmd.exe as Administrator, and add another entry to the boot loader using bcdedit utility:
C:\> bcdedit /copy {current} /d "Windows 7 with kernel debug via COM"
Then enable debug mode on new entry UUID:
C:\> bcdedit /debug {UUID-RETURNED-BY-FORMER-COMMAND} on
Now instruct Windows serial communication as debugging medium, and use the “fastest” baud rate (i.e 115200 symbols/sec). Since we’ll only use serial debugging for this VM, we can use the bcdedit /dbgsettings global switch.
C:\> bcdedit /dbgsettings serial debugport:1 baud rate:115200
Note: if we wanted to set debug settings specific to one entry of the boot loader, we would’ve used bcdedit /set instead. For instance:
C:\> bcdedit /set {UUID-RETURNED-BY-FORMER-COMMAND} debugtype serial
Now, shutdown the VM and go to its settings on VirtualBox (Machine -> Settings) and in the “Serial Ports” tab, enable one port and bind it to COM1 (since we used the debugport:1 above with bcdedit), and select Host Pipe as Port Mode. Last provide a path to file in the Path/Address field, for example /tmp/win7-kd-pipe.
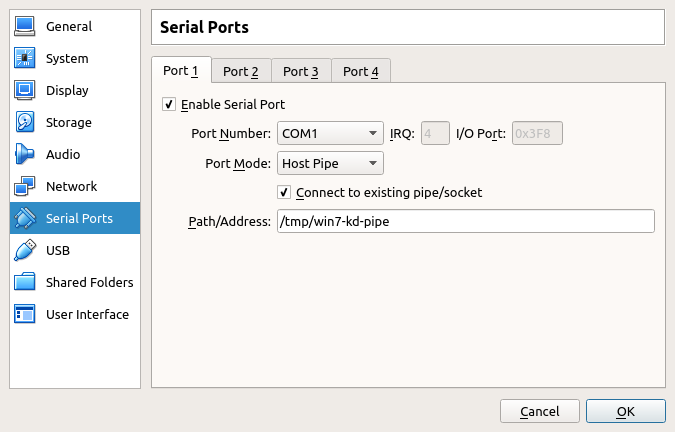
The tickbox Connect to existing pipe/socket means that the debuggee will always have to be started after the debugger VM, or VirtualBox will throw an error.
Running the debugging session
On the debugger
Start the debugger VM first and prepare WinDBG for kernel-mode debugging (Ctrl-K) by selecting COM as debug vector:
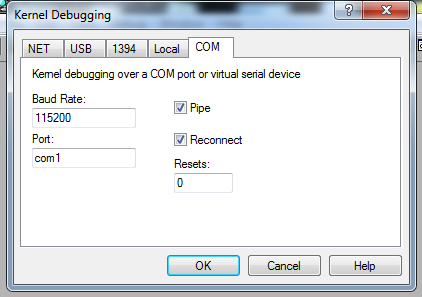
WinDBG will then wait for communications on COM1.
Microsoft (R) Windows Debugger Version 6.3.9600.17298 X86
Copyright (c) Microsoft Corporation. All rights reserved.

Opened \\.\com1
Waiting to reconnect...

************* Symbol Path validation summary **************
Response                         Time (ms)     Location
Deferred                                       srv*c:\syms*http://msdl.microsoft.com/download/symbols
On the debuggee
Start the debuggee, and when the boot loader menu shows up, select the entry named Windows 7 with kernel debug via COM.
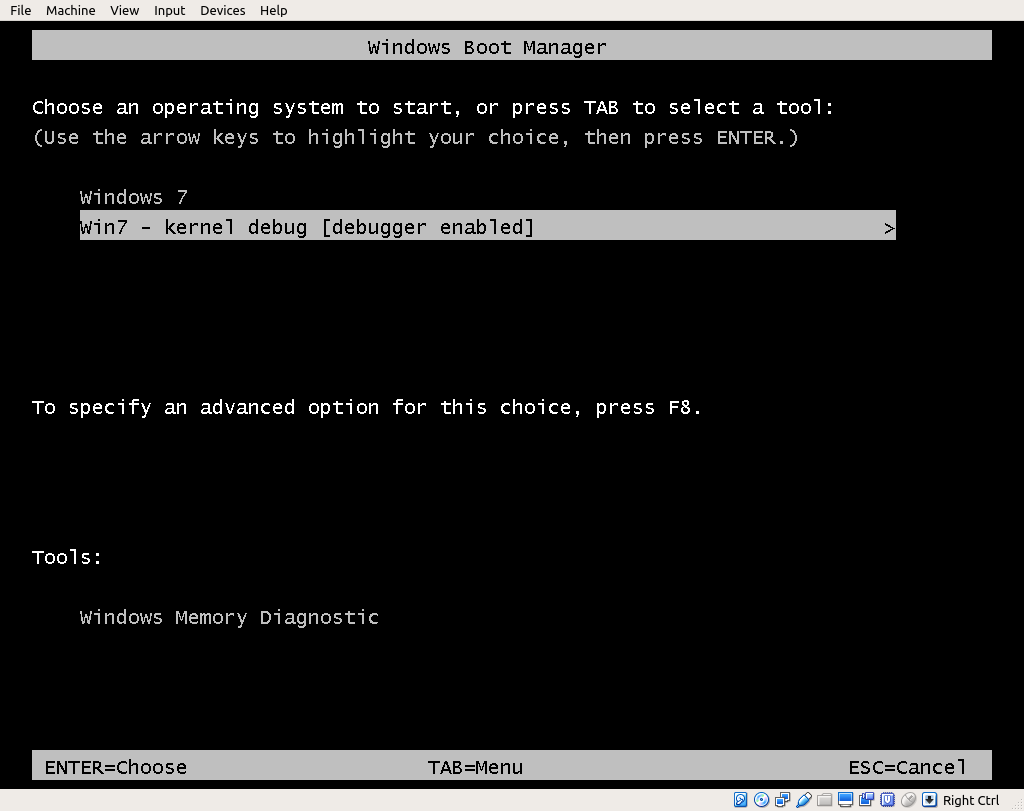
As you see Windows already indicates that this entry will be in debug mode. And when you press Enter, the debugger VM will be attached to the debuggee.
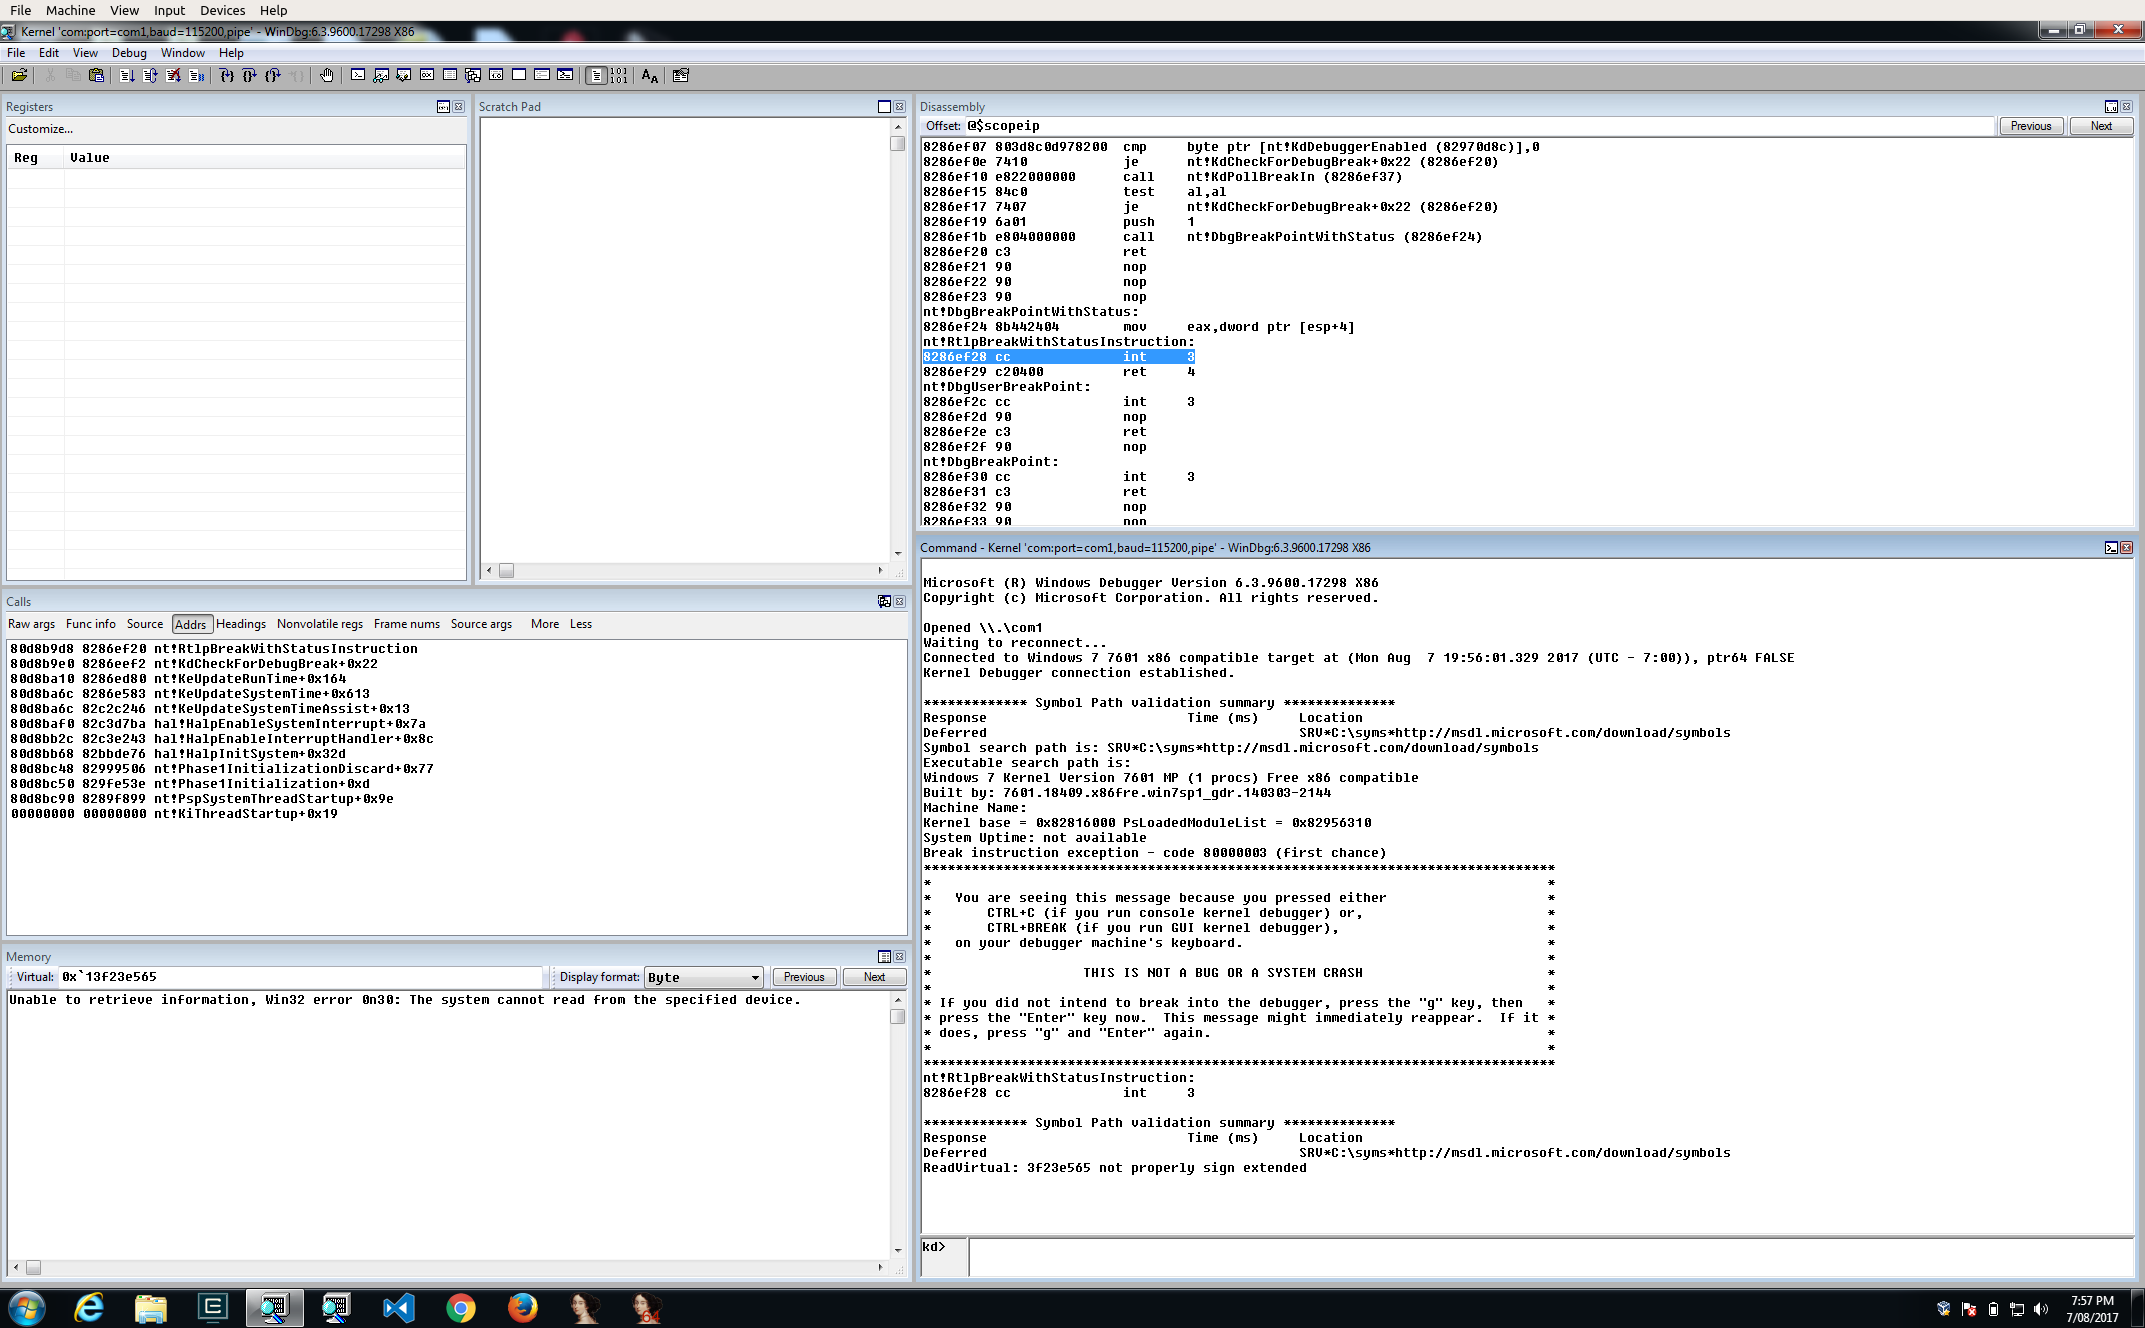
You’re now debugging the Windows 7 x86 VM kernel!! But as you’ll see, Serial Port debugging will drastically slow down all operations on the debuggee. This is why projects like VirtualKD came to life, but personnally, if the target VM is a Windows 8+, my favorite kernel debugging method is Network based, as detailed below.
Setup Network kernel debugging for the Windows 8+ target
Note: All is described here.
IMHO, this method is the best and fastest method to debug Windows kernel, but it has 2 constraints:
- you must use a compatible network adapter (not so much a problem for VirtualBox or VMware)
- the debuggee must be running Windows 8 or later.
When preparing the VM, make sure to add an extra Network Card as Host-Only, and linked to the same interface as the one specified on the host (i.e. vboxnet0). Important note: in the “Advanced” section, select one of the Intel Pro card (preferably PRO/1000 MT Desktop). The reason for that is that Windows network kernel debugging does not work with all network controllers.
Boot the VM, and then open the “Device Manager” (Control Panel -> System -> Advanced system settings -> on the Hardware tab). Expand “Network adapters” and select the 2nd device’s properties menu. On the new window, the “Location” field will be required to assignate this interface for debugging:
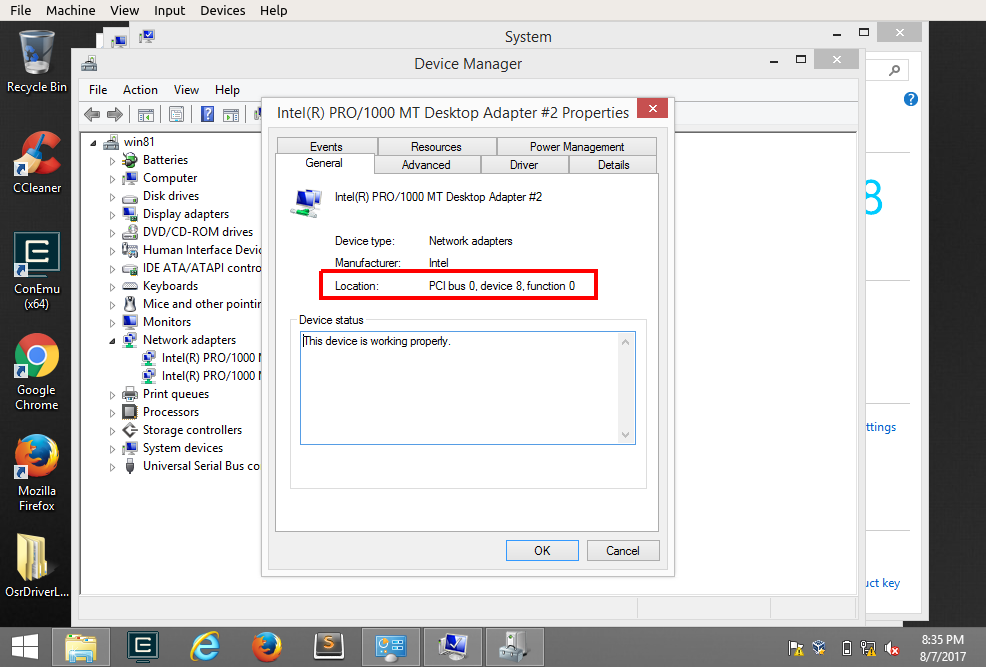
This indicates us the bus parameters we will need to provide bcdedit later on, with the format <BusNumber>:<DeviceNumber>:<FunctionNumber> (in this case 0.8.0).
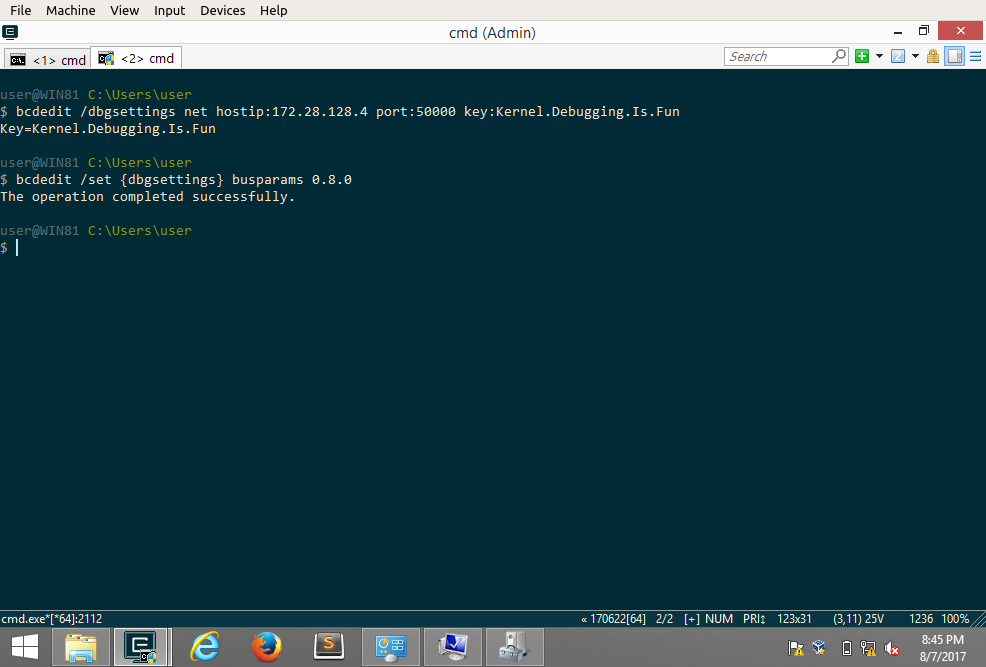
Now open an administrator prompt and use bcdedit utility to create a new entry to the boot manager like we did on Windows 7, and enable the debug mode for it. But unlike Windows 7, now we have to setup the network properties:
C:\> bcdedit /dbgsettings net hostip:ip.of.debugger.vm port:50000 key:Kernel.Debugging.Is.Fun
C:\> bcdedit /set {dbgsettings} busparams <BusNumber>.<DeviceNumber>.<FunctionNumber>
Running the debugging session
On the debugger
Start the debugger VM first and prepare WinDBG for kernel-mode debugging (Ctrl-K) by selecting NET as debug vector, and set the Port and Key adequately. WinDBG will then be waiting for new connection:
Microsoft (R) Windows Debugger Version 6.3.9600.17336 AMD64
Copyright (c) Microsoft Corporation. All rights reserved.

Using NET for debugging
Opened WinSock 2.0
Waiting to reconnect...
On the debuggee
Start the VM. When the boot loader menu shows up, select the one with the network kernel mode enabled
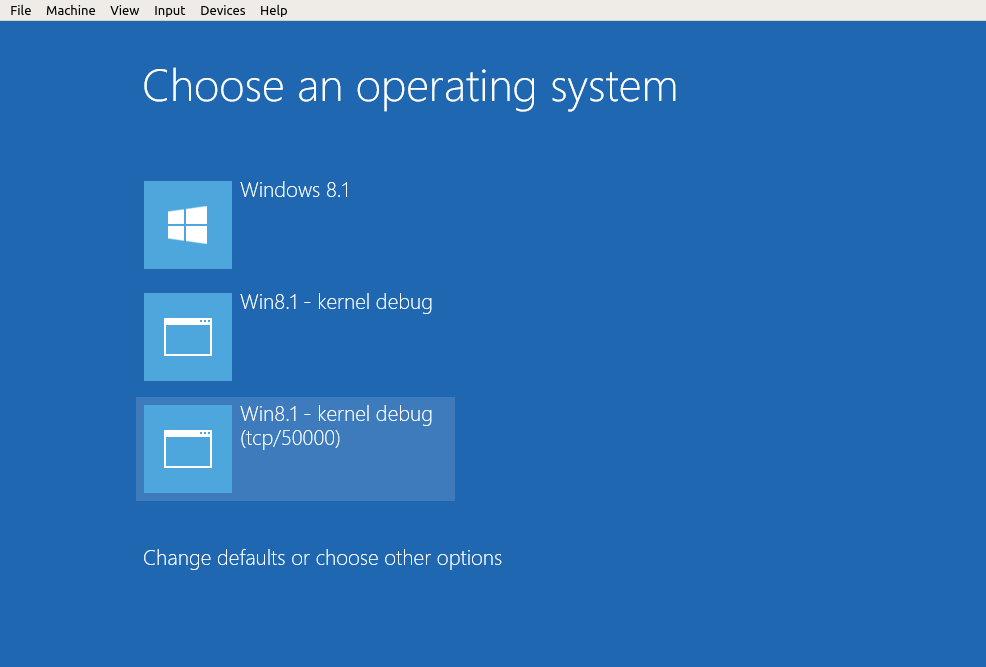
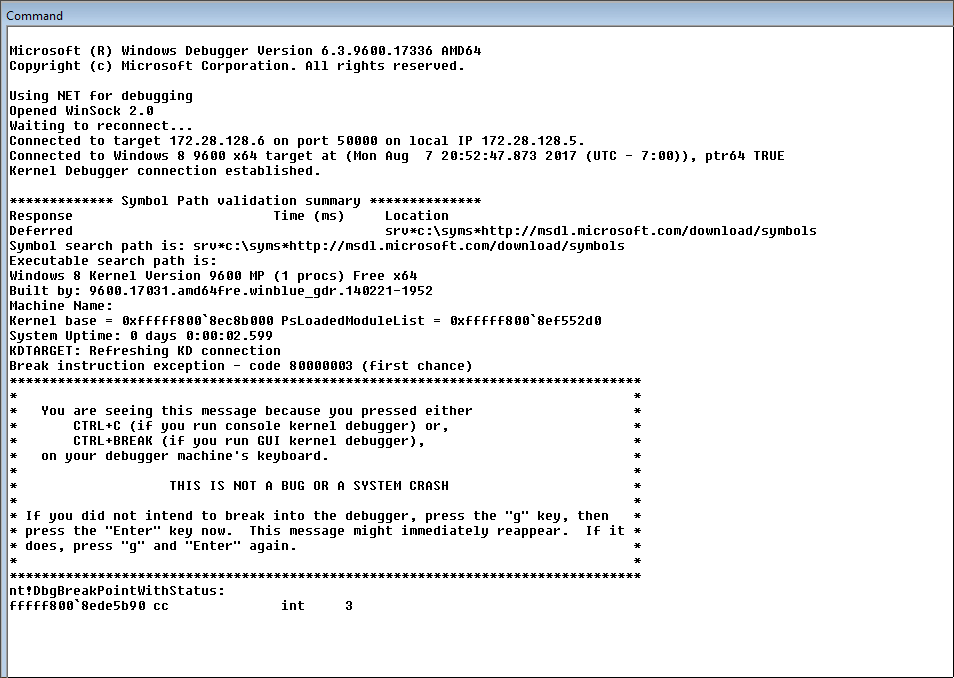
The debugger will show some activity immediately. Note that execution of the debuggee will not stop, so you may hit Ctrl-Break at any time to force an interruption:
In this post, we’ve presented 2 techniques for kernel debugging, depending on the Windows version targeted. Some other techniques exist (FireWire, USB debugging) but they are slightly harder to put in place.
The next post will cover more of Windows kernel exploitation 101 by going through some vulnerabilities on the HEVD driver.
Cheers ✌