This post summarizes some of the work I’ve been doing for the past few months during my (few) off times. Nothing new, mostly just a structured reminder for my later self.
Introduction
What-The-Fuzz is one of my favorite tools, and beyond the tool itself I really enjoy the story behind the creation of the tool itself and all of the surrounding libraries 0vercl0k had to build, including kdmp-parser, symbolizer, leveraged yrp’s underestimated bochs-based emulation library bochscpu. 0vercl0k explained all of this better than I possible could, so if you haven’t read it yet, please stop reading this post now and read the blog post dedicated to WTF: Building a new snapshot fuzzer & fuzzing IDA.
I used to use memory dump mostly as a final way to access the crashing condition and execution context of a program before its crash. Dumps are very much used for debugging, fuzzing crash analysis, and sometimes for DFIR (like with the famous - RIP? - Volatility does). But to my knowledge, WTF was the first tool to use them for snapshot-based fuzzing (* if not, please shoot me a remark in the Discussion).
Following the well-known Feynman principle that “what you cannot create, you do not understand”, I wanted to see where digging into this topic will lead me. And boy wasn’t I disappointed… But first and before all, I wanted whatever my work to be Python because:
- it is the de-facto language for quick prototyping, comes with an awesome REPL and has a great ecosystem via PyPI
- has a great capability to interact with lower level machine code
- I know and like the language
So immediately, I was stopped: originally bochscpu was written in Rust, kdmp-parser and udmp-parser in C++ and only kdmp-parser had an embryo of Python bindings (many API/structures missing, no PyPI). Perfect, so I set myself to completely dive into those libs by
- creating Python bindings for
udmp-parserandbochscpu - improving the Python bindings
kdmp-parseroriginally had, developed bymasthoon
At the time of this article, anyone can pip install any of those packages and start playing directly within the Python interpreter 3.8+ on either Windows, Linux and MacOS (since 0.1.7+) So just in order to reproduce any of the stuff mentioned below, all one would need do is:
pip install udmp-parser kdmp-parser bochscpu-python
to be fully set to follow along with the experiments below. Having the pre-requisites we can start digging (because yes, all that initial work was only to get start the intended research) by:
- using
udmp-parserto parse user-mode process dumps - or using
kdmp-parser, to parse kernel memory dumps - and use those information to reconstitute a workable environment (memory layout, cpu context, etc.) for
bochscputo run whatever code we choose to.
The best parts (IMO) about all of this was that this whole setup works no matter the process and allow us to get an absolute control over the execution.
We will explore each case individually, but first let’s examine a bit more the libraries at hand.
Quick lib peek
This part is important as none of what follows would have been possible without those libraries, it is only fair to promote them first.
Bochs[1]/BochsCPU[2]
It is well-known that the Bochs emulator has incredibly powerful instrumentation capabilities and is regarded as being very faithful to the x86 ABI implementation itself (including the most recent extensions). BochsCPU by yrp, on the other hand, is a Rust library that wraps the Bochs CPU code and exposes via Rust API (and C++ via FFI) all the instrumentation points (context switches, interrupts, exceptions, etc) that Bochs does. This makes it a useful tool for tasks such as developing code any X86 mode, dealing with very old, mission-critical software, and assisting in reversing/vulnerability research tasks.
And that’s an amazing environment since Bochs is extremely faithful to what the x86 cpu actually executes, it will be merciless should you fail to prepare the CPU state adequately (missing flags when setting long mode, forgot to reset a trap flag, etc.). Even though that could seem tedious, especially if compared to unicorn/qemu for instance, that abstracts everything beforehand to the dev. But I believe such behavior by forcing to read carefully the Intel manuals to have the expected behavior, it only makes you know X86 CPU better.
udmp-parser[3]/kdmp-parser[4]
udmp-parser and kdmp-parser are both cross-platform C++ parser library written by 0vercl0k for Windows memory dumps, respectively for user-mode (using .dump /m in WinDbg) and kernel-mode (.dump /f|/ka in WinDbg) dumps. And cherry on top, both come with Python3 bindings, allowing for quick prototyping.
Windows Kernel-mode emulation
Armed with those libraries, running the emulator from a Windows kernel dump is now “relatively” simple (as opposed to user-mode, we’ll detail why in the next part) because the dump is nothing more but a snapshot of the OS state at a given time.
First, always take a solid dump
First from a KdNet session, you can easily create a dump at an interesting point. When looking for interesting attack surface, I like to use my own IRP monitor tool #ShamelessSelfPromo; but for our example really anything would do, like the following:
kd> bp /w "@$curprocess.Name == \"explorer.exe\"" nt!NtDeviceIoControlFile
[...]
Breakpoint 0 hit
nt!NtDeviceIoControlFile:
fffff807`4f7a4670 4883ec68        sub     rsp,68h
One way to get the dump would be using .dump command as such
kd> .dump /ka c:\temp\ActiveKDump.dmp
But a better way would be to use the yrp’s bdump.js script
kd> .scriptload "C:\bdump\bdump.js"
[...]

kd> !bdump_active_kernel "C:\\Temp\\ActiveKDump.dmp"
[...]
[bdump] saving mem, get a coffee or have a smoke, this will probably take around 10-15 minutes...
[...]
[bdump] Dump successfully written
[bdump] done!
Build the BochsCPU session
Parsing the dump with kdmp_parser.KernelDumpParser is as simple as it gets so let’s leave it to that. For BochsCPU to run it’s critical to have a PF handler callback, which can be done as a simple on-demand basis: full memory dumps can be several gigabytes in size, so it seems unreasonable to map it all on host, especially since when we probably are going to need a fraction of that. This ended up being relatively elegant and simple:
dmp = kdmp_parser.KernelDumpParser(pathlib.Path("/path/to/dumpfile.dmp"))

def missing_page_cb(pa: int):
  gpa = bochscpu.memory.align_address_to_page(pa)
  if gpa in dmp.pages:          # do we already have the page in the dump?
    # then create & copy the page content, resume execution
    hva = bochscpu.memory.allocate_host_page()
    page = dmp.read_physical_page(gpa)
    bochscpu.memory.page_insert(gpa, hva)
    bochscpu.memory.phy_write(gpa, page)

sess = bochscpu.Session()
sess.missing_page_handler = missing_page_cb
This gives us a first chance to address missing pages, whereas the PageFault exception triggered by the CPU (i.e PageFault -> BX_PF_EXCEPTION (14) ) will give us a second chance to analyze the page fault, as the error code will be populated, we can check the reason of the fault using the Intel 3A - 4.7 section of the Intel manuals.
Next, a bochscpu.State must be given to the CPU indicating the context from which to start including the (extended) CR, GPR, flag registers and segment registers. Note that several helpers can be found in bochscpu.cpu to slightly speed up that process.
regs = json.loads(pathlib.Path("/path/to/regs.json").read_text())
state = bochscpu.State()
bochscpu.cpu.set_long_mode(state)
[...]
state.cr3 = int(regs["cr3"], 16)
state.cr0 = int(regs["cr0"], 16)
state.cr4 = int(regs["cr4"], 16)
[...]
state.rax = int(regs["rax"], 16)
state.rbx = int(regs["rbx"], 16)
state.rcx = int(regs["rcx"], 16)
state.rdx = int(regs["rdx"], 16)
[... snip for brievety]
sess.cpu.state = state
Last (but technically optionally), define the Bochs callbacks on the plethora of hookable events:
def before_execution_cb(sess: bochscpu.Session, cpu_id: int, _: int):
    state = sess.cpu.state
    logging.info(f"Executing RIP={state.rip:#016x} on {cpu_id=}")

hook = bochscpu.Hook()
hook.before_execution = before_execution_cb
hooks = [hook,]
And finally kick things off with a simple call
sess.run(hooks)
sess.stop()
$ python kdump_runner.py
Executing RIP=0xfffff80720a9d4c0 on cpu_id=0
Executing RIP=0xfffff80720a9d4c4 on cpu_id=0
Executing RIP=0xfffff80720a9d4cb on cpu_id=0
Executing RIP=0xfffff80720a9d4d0 on cpu_id=0
Executing RIP=0xfffff80720a9d4d4 on cpu_id=0
Executing RIP=0xfffff80720a9d4dc on cpu_id=0
Executing RIP=0xfffff80720a9d4e1 on cpu_id=0
Executing RIP=0xfffff80720a9d4e8 on cpu_id=0
Executing RIP=0xfffff80720a9d4ec on cpu_id=0
[...]
For a complete and more detailed example, the reader can refer to the example in the bochscpu-python repository: examples/long_mode_emulate_windows_kdump.py
Windows User-mode emulation
There are way more than one way of snapshotting a process on Windows (like WinDbg, Task Manager, procdump, processhacker, etc.) so I will skip and assume you have a snapshot ready.
Emulating usermode code on BochsCPU turned out to be slightly more tricky than kernel mode: the kernel dump includes an almost complete OS snapshot include all the kernel sections required by the MMU to function properly and all what was needed was to map those pages to Bochs whenever they were needed.
A user-mode dump on Windows does not include any of those information but only that related to the usermode process itself - which, despite being already a lot of information, is insufficient to simply re-use what was done for kernel mode emulation. And we must remember that BochsCPU is only, well, the CPU: meaning it can execute anything but it needs to have everything set it up, such as the processor mode (real, protected, long), the map pages, etc. But then, if the process runs in protected/long mode, memory accesses via the MMU must also be correctly laid off so ensure the VirtualAddress → PhysicalAddress translation works. We therefore, are required to build own page table for the process. Since this process is documented everywhere on the Internet, I will assume the reader to be familiar and skip this part by mentioning that bochscpu-python provides an easy way to expedite the process of setting things up:
dmp = udmp_parser.UserDumpParser()
assert dmp.Parse(dmp_path)
pt = bochscpu.memory.PageMapLevel4Table()
pa = PA_START_ADDRESS

# Collect the memory regions from the Windows dump
# For each region, insert a new PT entry
for _, region in dmp.Memory().items():
    if region.State == MEM_FREE or region.Protect == PAGE_NOACCESS:
        continue
    start, end = region.BaseAddress, region.BaseAddress + region.RegionSize
    for va in range(start, end, PAGE_SIZE):
        flags = convert_region_protection(region.Protect)
        if flags < 0:
            break
        pt.insert(va, pa, flags)
        hva = bochscpu.memory.allocate_host_page()
        bochscpu.memory.page_insert(pa, hva)
        print(f"\bMapped {va=:#x} to {pa=:#x} with {flags=}\r", end="")
        pa += PAGE_SIZE

# Commit all the changes, resulting in a valid PT setup for the VM
for hva, gpa in pt.commit(PML4_ADDRESS):
    bochscpu.memory.page_insert(gpa, hva)
A couple of other things are required: the first one is that just like for what was done for kernel dumps, we must import all registers (GPR, flags). Another thing (but related) relies in the thread selection: when the VM execution will resume, the CPU cannot work without relying on the segment registers, which are provided from its state by the values set in the CS, DS, SS segment registers. Thankfully those values can be retrieved straight from the dump:
threads = dmp.Threads()
tids = list(threads.keys())
tid = tids[0] # whatever teh first thread is, but TID can be hardcoded too
switch_to_thread(state, threads[tid])

def switch_to_thread(state: bochscpu.State, thread: udmp_parser.Thread):
  # build CS
  _cs = bochscpu.Segment()
  _cs.base = 0
  _cs.limit = 0xFFFF_FFFF
  _cs.selector = thread.Context.SegCs
  _cs_attr = bochscpu.cpu.SegmentFlags()
  _cs_attr.A = True
  _cs_attr.R = True
  _cs_attr.E = True
  _cs_attr.S = True
  _cs_attr.P = True
  _cs_attr.L = True
  _cs.attr = int(_cs_attr)
  state.cs = _cs

  # do the same for the others (obvisouly adjusting values/flags)
Similarly not the CPU but Windows also requires the FS (for protected and long modes) and the GS registers (in long mode).
Ok, now we have built everything need for the emulation to run successfully in a Windows environment. Let’s focus on what could we want to execute next…
PGTFO
TL;DR You can predict through emulation the values of Windows PRNG (see examples/long_mode_emulate_windows_udump.py)
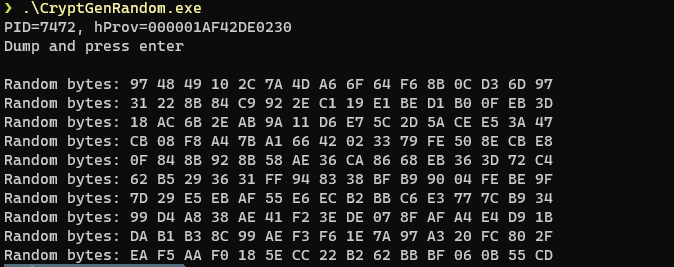
Coincidentally as part of some research I was doing for work on ransomware, I examined the possibility of retrieving session keys used by ransomware, by snapshotting culprit ransomware processes, and generating a using memory dumps using canary files (the full article is available here if interested). As thoroughly detailed in the article, investigating WANNACRY revealed that it uses Windows PRNG to create the AES128 keys for each file. Which triggered the idea behind that post, which was that by using canary files to detect ransomware encryption early one, and generating a dump of the process at that point, can we retrieve all the subsequent symmetric keys (and essentially making ourselves a free decryptor).
Since snapshotting the process gives us the current state of the PRNG for that process, we can now use emulation to discover the following values. A basic PoC for it would be as follow:
#include <windows.h>
#include <wincrypt.h>
#include <stdio.h>
#pragma comment(lib, "advapi32.lib")

int main()
{
    HCRYPTPROV hCryptProv;
    CryptAcquireContext(&hCryptProv, NULL, NULL, PROV_RSA_FULL, CRYPT_VERIFYCONTEXT);
    printf("PID=%lu, hProv=%p\nDump and press enter\n", GetCurrentProcessId(), (void *)hCryptProv);
    getchar(); // We break here and snapshot the process

    for (int i = 0; i < 10; i++)
    {
        BYTE randomBytes[16] = {0};
        CryptGenRandom(hCryptProv, sizeof(randomBytes), randomBytes)
        printf("Random bytes: ");
        for (int i = 0; i < sizeof(randomBytes); i++)
          printf("%02X ", randomBytes[i]);
        printf("\n");
    }

    CryptReleaseContext(hCryptProv, 0);
    return 0;
}

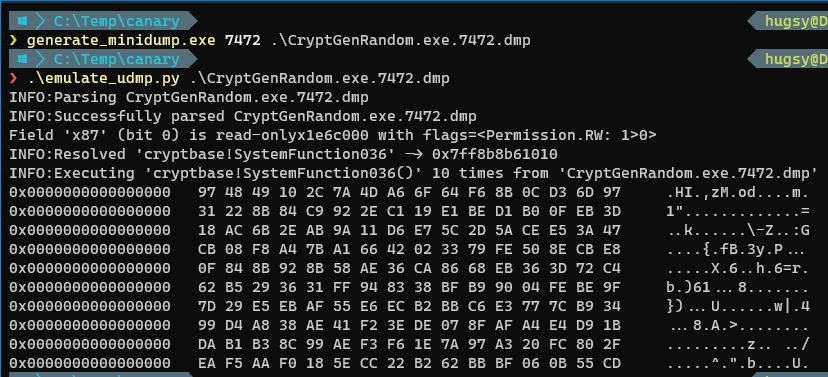
Continuing our emulator from above, we can now invoke directly any function (here we’re interested in cryptbase!SystemFunction036) in the dump:
logging.debug(f"Resolving 'cryptbase!SystemFunction036'")
fn_start = resolve_function(fn_sym)
fn_end = fn_start + 0x1C # hardcode the end address of the function for now

state.rcx = temp_buffer_va
state.rdx = 16
state.rip = fn_start

hook = bochscpu.Hook()
hook.before_execution = lambda s, _: s.cpu.state.rip == fn_end and s.stop()
sess.run([hook,])
And we can successfully dump all future values:

Same values, mission accomplished.
Hey, but what about Linux?
Well as the saying goes…

using lief we can parse and populate the memory layout
/**
 * For demo purpose, compiled with `-static`
 */
#include <stdlib.h>
#include <stdio.h>
#include <stdint.h>
#include <time.h>

void generate_random_buffer(uint8_t* buf, size_t sz)
{
  for(int i=0; i<sz; i++)
    buf[i] = rand() & 0xff;
}

int main()
{
  srand(time(NULL));
  uint8_t buf[0x10] = {0};
  generate_random_buffer(buf, sizeof(buf));
  getchar(); // get a coredump
  for(int i=0; i<sizeof(buf); i++)
    printf("%02x ", buf[i]);
  puts("");
  return 0;
}
and unsurprisingly, same result
Similarly the source of this script too was added to the examples/ folder of bochscpu-python available here so feel free to try it at home 🙂
BochsPwn (Re-)Reloaded?
BochsPwn (and BochsPwn-Reloaded) is a project developed by j00ru which leveraged Bochs instrumentation capability to detect (among other things) TOCTOU race conditions in the Windows kernel. The brilliance behind that tool can (partially) become relevant again for kernel memory dumps, by simply tracking executions and memory accesses. This can be achieved crudely by extending the kernel dump runner we had earlier, and adding a callback for linear memory accesses in bochscpu as such:
@dataclass
class TrackedMemoryAccess:
    timestamp: int
    pc: int
    address: int
    access: bochscpu.memory.AccessType

def lin_access_cb(
    sess: bochscpu.Session,
    cpu_id: int,
    lin: int,
    phy: int,
    len: int,
    memtype: int,
    rw: int,
):
    global tracked_accesses

    state = sess.cpu.state
    if lin >= MAX_USERMODE_ADDRESS:
        # Ignore accessed linear address as long as it stays in KM
        return

    if rw:
        # Ignore write access (for now)
        return

    # Track the current access
    cur = TrackedMemoryAccess(sess[AUX_INSN_COUNT], sess[AUX_LAST_RIP], lin, bochscpu.memory.AccessType(memtype))
    logging.debug(f"{cur.pc=:#x}: {cur.address=:#x} -> {phy=:#x} {len=} {cur.access=}")

    # Look for previous accesses
    for old in tracked_accesses:
      # Any access to the same VA means a match
      if old.address == cur.address and old.access == cur.access:
          logging.error(
            f"Possible usermode {cur.access} double fetch on VA={cur.address:#x}:\n"
            f"1st access at {old.pc:#x} -> {old.insn(sess)}\n"
            f"2nd access at {cur.pc:#x} -> {cur.insn(sess)}\n"
            f"exec distance: {cur.timestamp - old.timestamp} insn(s)"
          )
          raise SuspiciousCrashException

    tracked_accesses.append(cur)

[..snip..]
hook.lin_access_cb = lin_access_cb

sess.run([hook,])
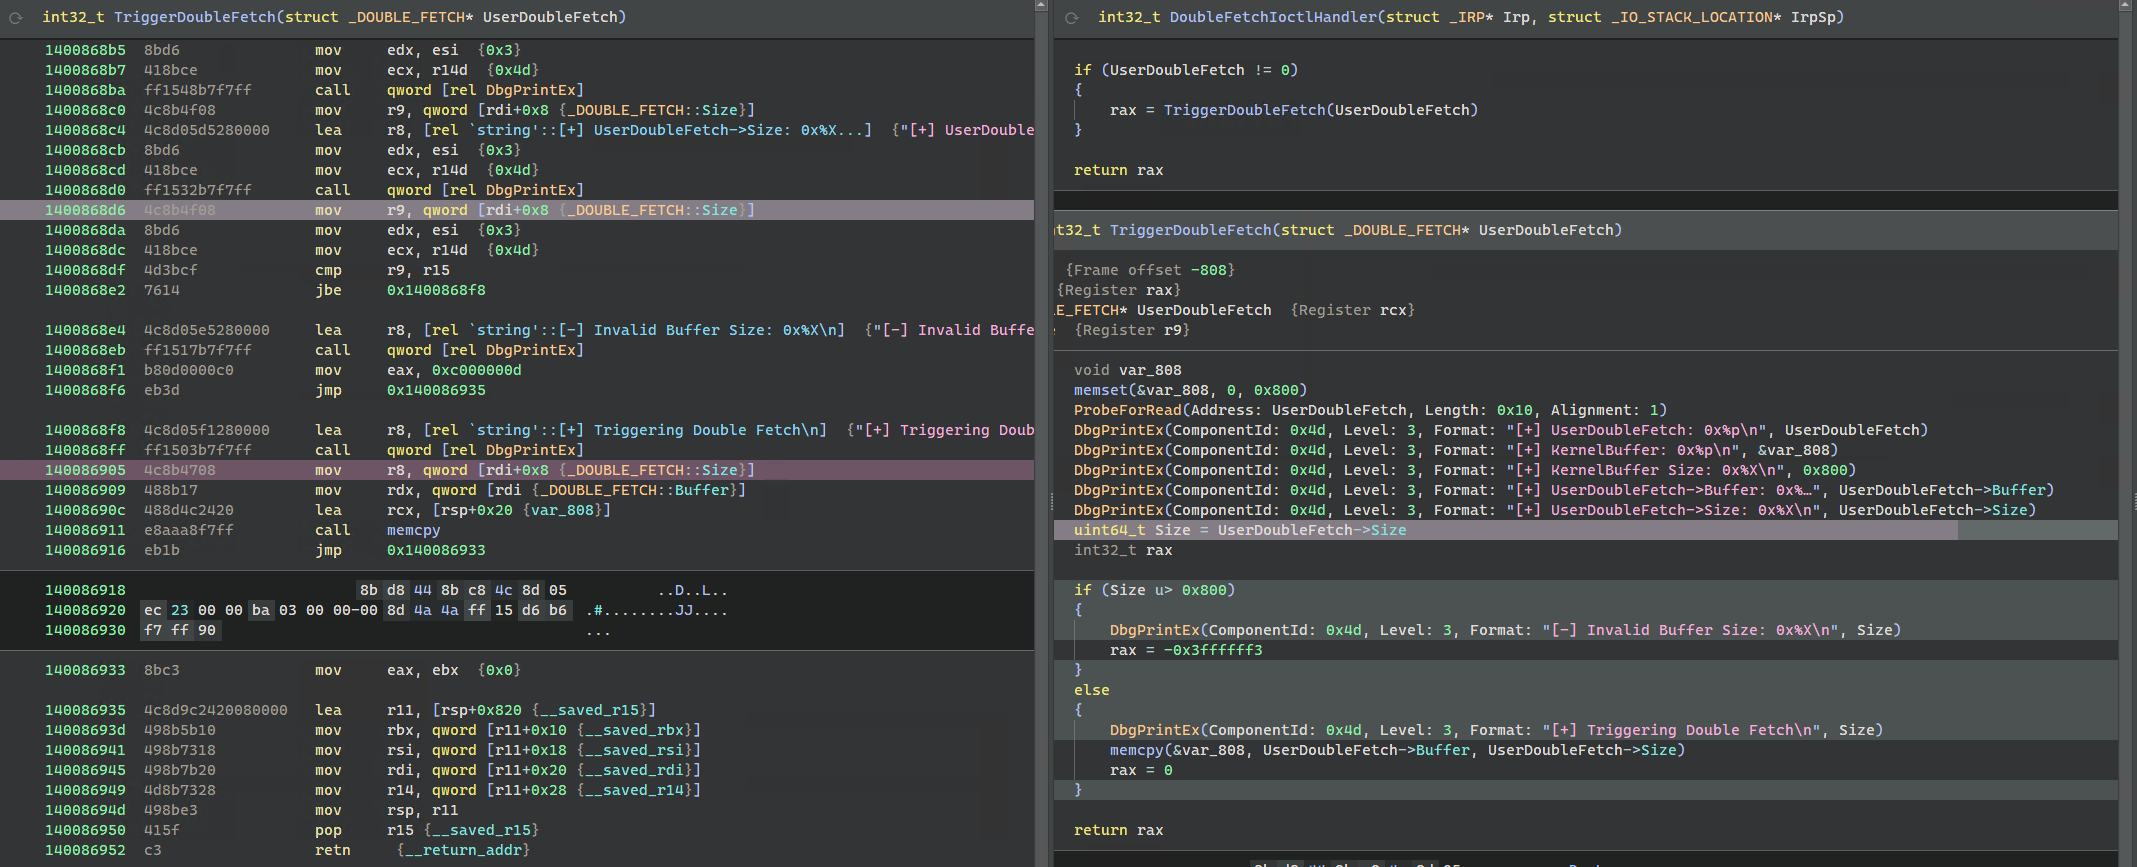
Testing with HEVD Double-Fetch example, immediately reveals it:
❯ python .\hevd_double_fetch.py X:\hevd_double_fetch_dump\mem.dmp X:\hevd_double_fetch_dump\regs.json
INFO:Parsed KernelDumpParser(X:\hevd_double_fetch_dump\mem.dmp, CompleteMemoryDump)
ERROR:Possible usermode bochscpu._bochscpu.memory.AccessType.Read double fetch on VA=0x5f0008:
1st access at 0xfffff8071fde68d6 -> mov r9, [rdi+8h]
2nd access at 0xfffff8071fde6905 -> mov r8, [rdi+8h]
exec distance: 85 insn(s)
ERROR:Exception  raised
> z:\bochscpu-fun\hevd_double_fetch.py(180)lin_access_cb()
-> raise SuspiciousCrashException

(Pdb) bochscpu.utils.dump_registers(sess.cpu.state)
rax=0000000000000000 rbx=0000000000000000 rdx=0000000000000001
rsi=0000000000000003 rdi=00000000005f0000 rbp=ffff988c2cebae90
rsp=fffffd8650f8e880 rip=fffff8071fde6909  r8=0000000000000008
 r9=000000000000004d r10=fffff8071fde5078 r11=fffffd8650f8e878
r12=0000000000000001 r13=ffff988c2d80ee00 r14=000000000000004d
r15=0000000000000800
efl=00040206 [ id vip vif AC vm rf nt of df IF tf sf zf af PF cf  ]
cs=0010  ss=0018  ds=002b  es=002b  fs=0053  gs=002b

(Pdb) print(utils.hexdump(bochscpu.memory.virt_read(sess.cpu.state.cr3, sess.cpu.state.rdi, 0x10)))
0x0000000000000000   AA AA AA AA AA AA AA AA 10 00 00 00 00 00 00 00     ................
Which we can double-check with a disassembler (highlighted in magenta)

Final remark
This article was made an attempt to structure all my notes over the last few months playing with memory dumps, and by no mean any comparison with WTF: WTF goes way further and does it better, with different emulation techniques and therefore should be used for fuzzing at scale. On the other hand having quick ways to re-create a fully working emulation context (whether user or kernel mode) from a process/memory dump with ~50 lines of Python is not without certain advantages.
Anyway, as always open for feedback on the discussion feed.
Until then see next time, Cheers 🍻
References
Here are the links to those giants referred in the title:

